
How can we identify the high and low performers in the tech sector based on their GHG emissions or energy consumption figures?
Since 2020, AdVaes has been analysing trends in the environmental performance of tech companies (data centre operators, cloud service providers, software publishers, digital services companies, hardware and processor manufacturers, etc.).
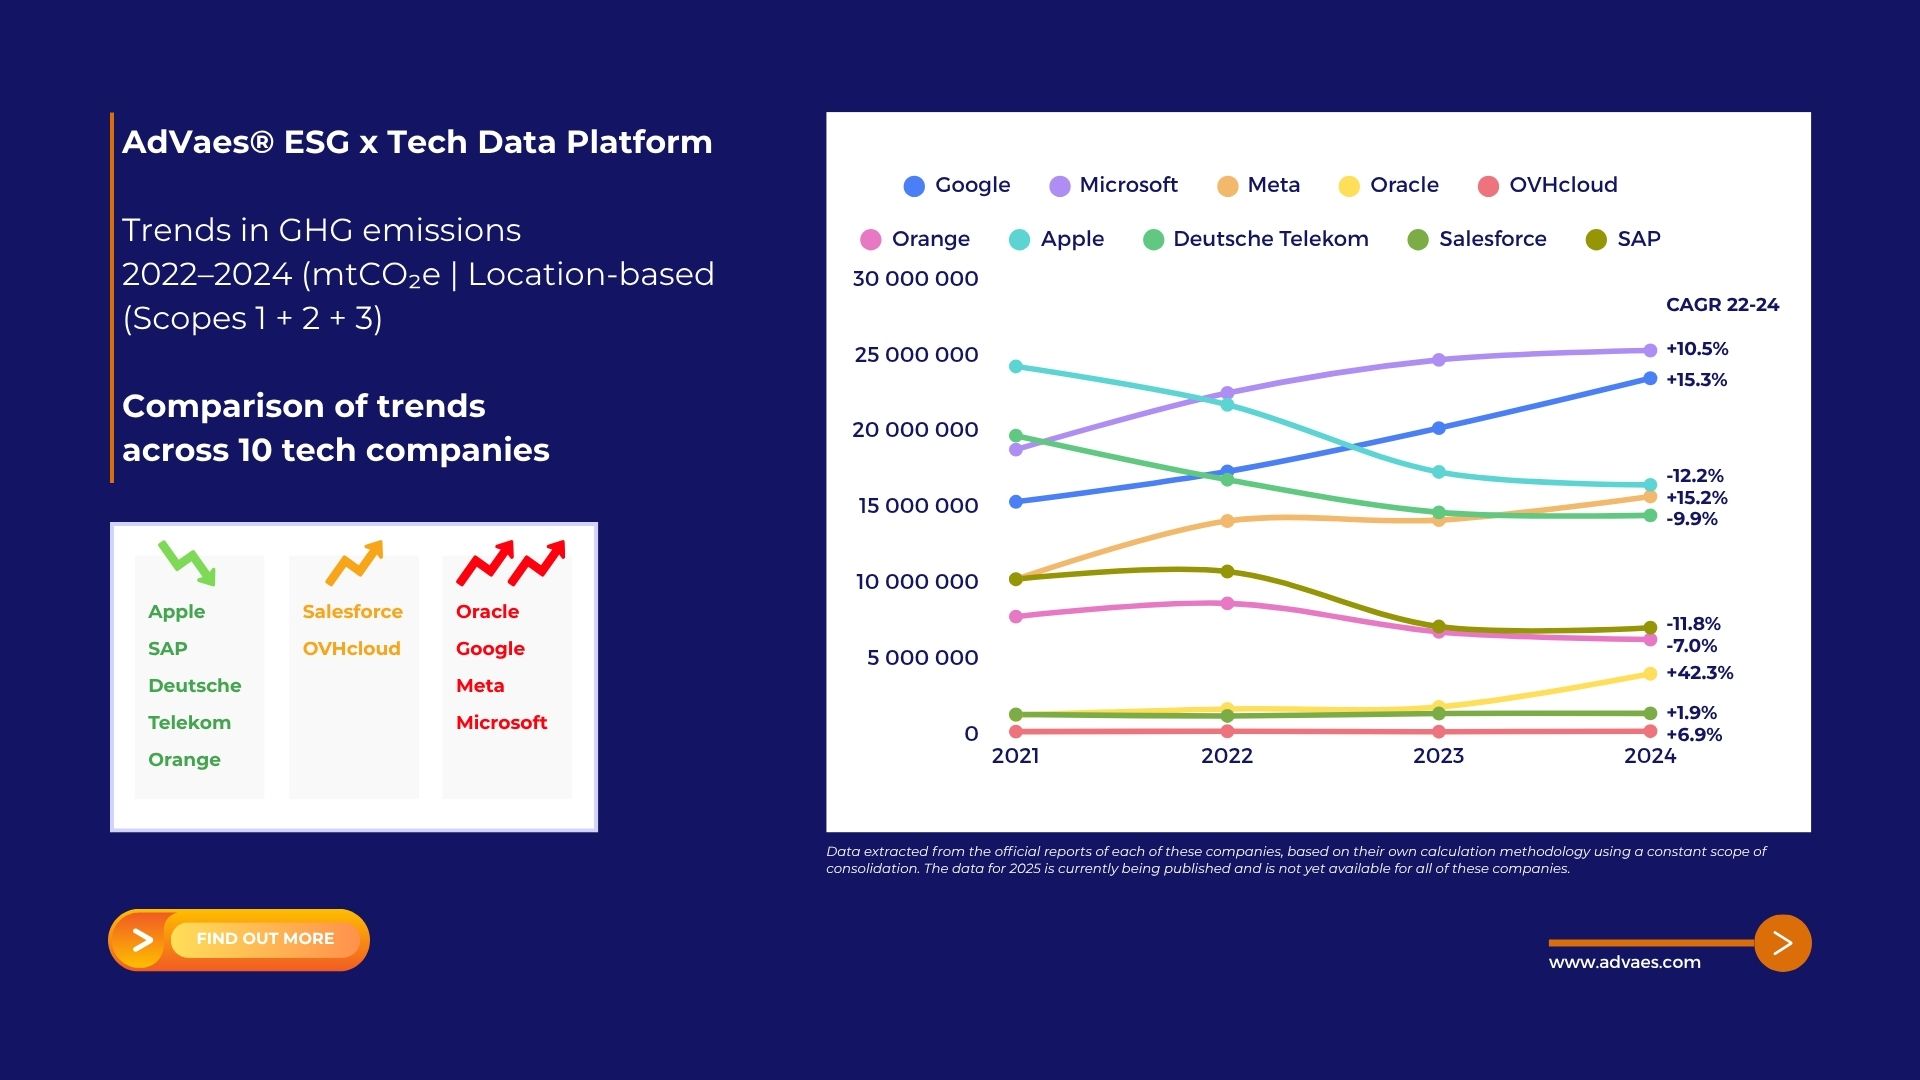
Whilst the 2025 data is gradually being made public*, an analysis of trends from previous years provides valuable insights. Looking solely at GHG emissions, an analysis of 10 tech companies reveals three main groups:
✅ Those whose mitigation and remediation efforts are reflected in the results, with significant annual average reductions. This is the case for companies such as Apple, SAP, Orange and Deutsche Telekom.
🟧 Those for whom the initiatives launched have not (yet) translated into results or have failed to curb the growth of their GHG emissions. This is the case for companies such as OVHcloud and Salesforce.
❌ Those whose GHG emissions continue to grow, year on year, faster than their business activities, and whose projected 2025 results do not suggest a significant reduction. This is the case for companies such as Oracle, Meta, Microsoft and Google.
The chart below illustrates these trends, in absolute terms, over the period from 2021 to 2024.
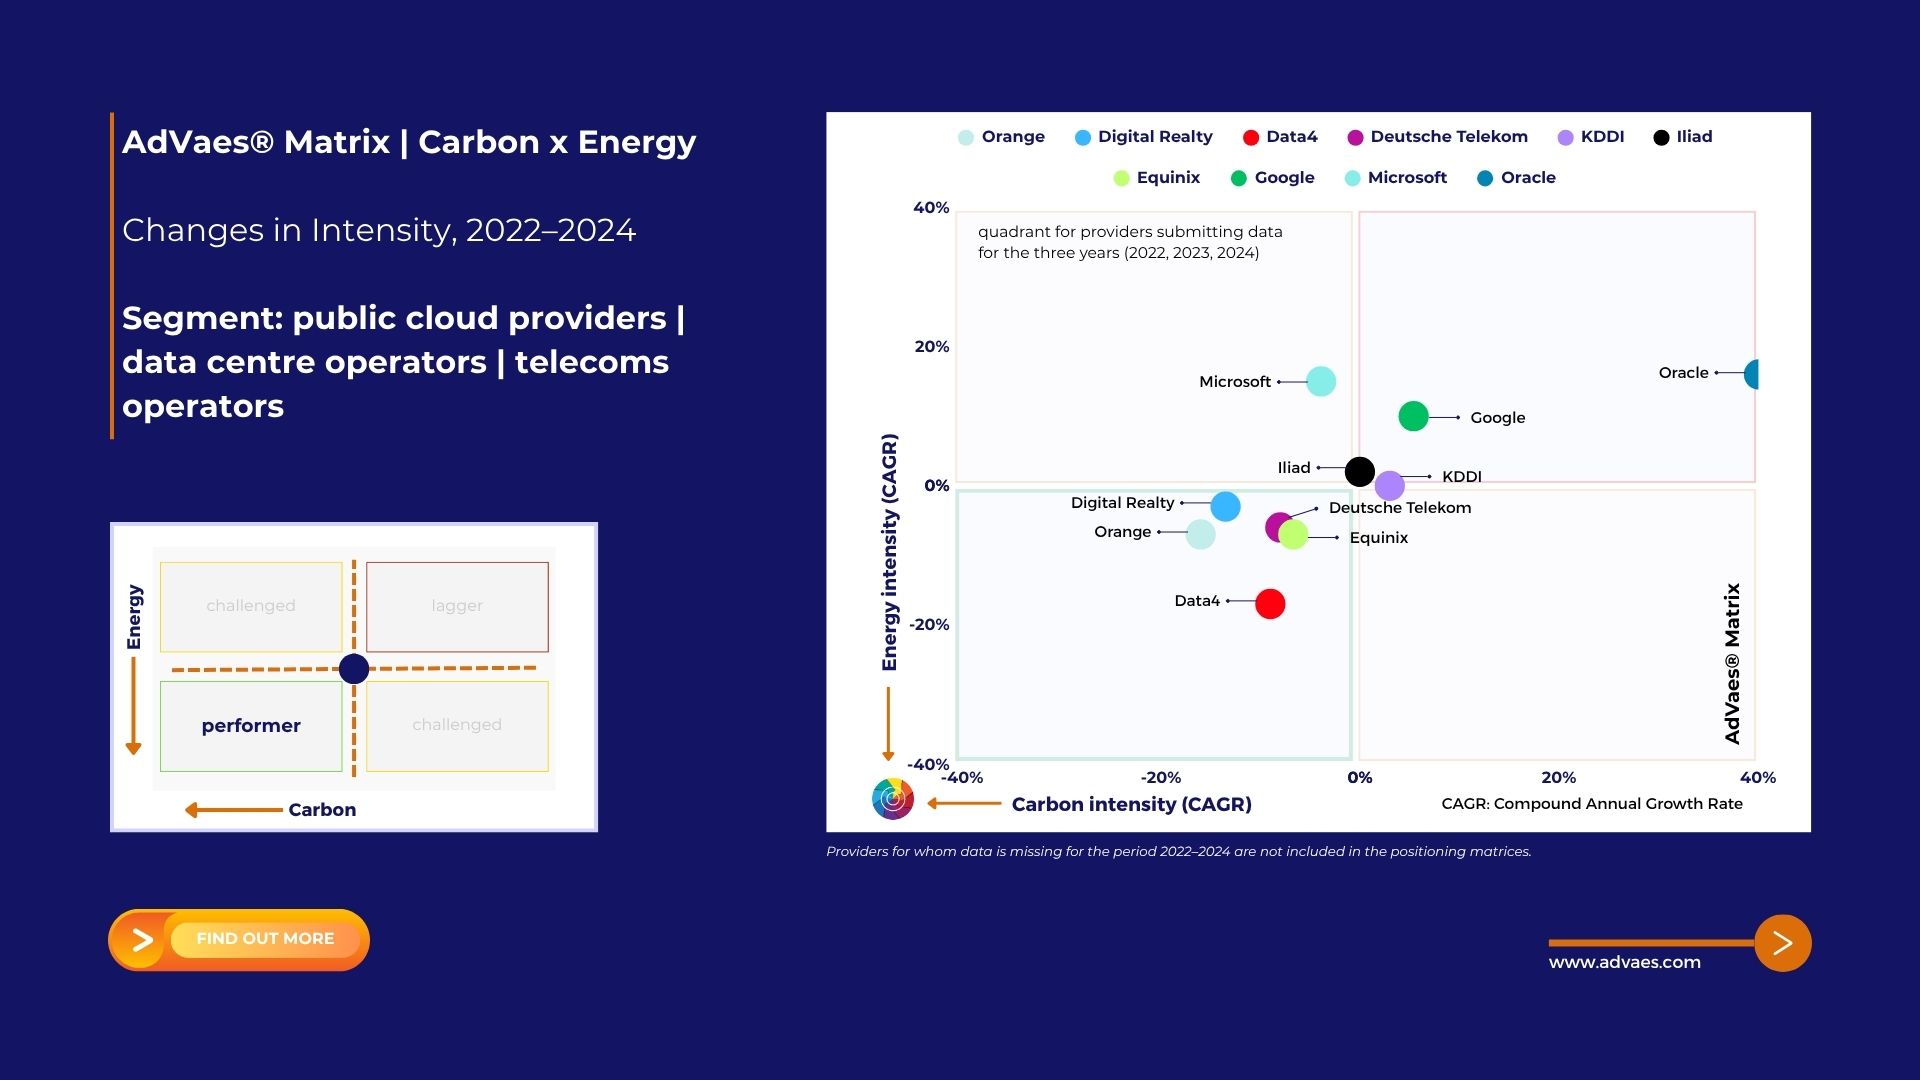
However, it is difficult to compare trends based solely on absolute figures. This is because the data provided by each of these service providers does not necessarily cover comparable scopes, and their calculations are not standardised. To overcome this issue, AdVaes has developed a methodology that quickly identifies the best-in-class organisations within a single matrix, the AdVaes® Matrix, based on their average performance trends over at least three consecutive years, whilst also taking into account changes in their business activity.
This matrix helps to:
▶️ Identify ‘top performers’ – those whose actions aim to address both energy intensity and carbon intensity indicators simultaneously, or at least at the same time.
▶️ Highlight paradoxes: some service providers reduce their emissions through the use of low-carbon energy sources but increase their overall consumption.
The AdVaes® Matrix covers the following profiles of IT service providers:
✅ Digital services firms.
✅ Software publishers (software + SaaS).
✅ Equipment manufacturers (hardware and components).
✅ Service providers (cloud providers, telecoms, data centres).
An example is also provided below for 10 leading companies in the service provider segment: Google, Orange, Digital Realty, Data4, Deutsche Telekom, KDDI Corporation, iliad Group, Equinix, Microsoft, Oracle.
Would you like to take things further with us, find out more about our ranking methodologies, or receive a bespoke assessment report on a specific IT service provider (including a broader scoring system, an analysis of strengths and weaknesses, AdVaes’ perspective, etc.)? 👉 Please contact us.
_________________
* They will be published between May and December 2026.
If you enjoyed this analysis, please feel free to share it.